Graphics theory
3D
With 2D drawing functions, such as drawTriangle(x0:int, y0:int, x1:int, y1:int, x2:int, y2:int), you can work directly with pixel coordinates. In a 3D world, this is no longer possible because objects appear smaller on the screen the further away they are. This means that two objects of the same size are not necessarily the same size on the screen. Therefore, we use a separate coordinate system for all 3D drawings, in which all distances are interpreted as meters and the origin is in the center.
For 3D drawings, there are three coordinate frames that are important: The fixed world frame, the current drawing frame, and the camera frame. By default, the world frame is a right-handed system with the x-axis pointing to the right, the y-axis pointing up, and the z-axis pointing out of the screen toward the user.
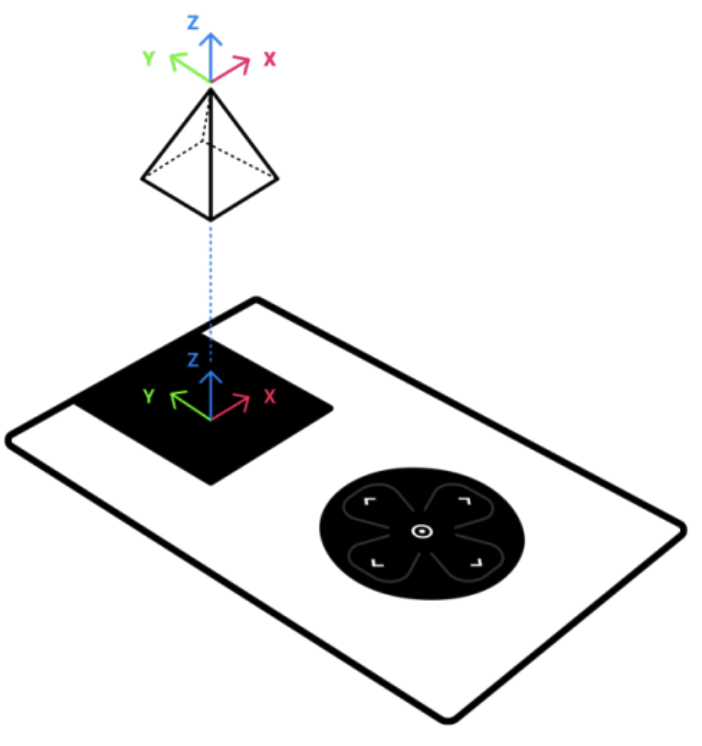
The camera is originally at the position (x=0, y=0, z=5) looking straight down. The x, y, and z axes are pointing in the same direction as the world frame (as shown in the figure above). The current drawing frame is on the world frame by default.
Thus, a 3D object is drawn (without prior translate or rotate) in the center of the screen, 5 meters away from the camera.
How does drawing work?
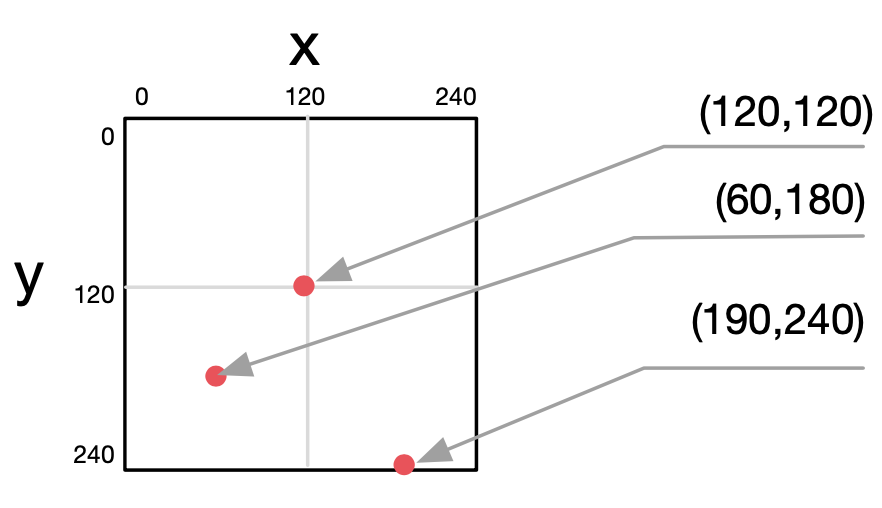
For drawing on the screen, several very powerful drawing commands are available. There are commands for points, lines, circles, ellipses, triangles, rectangles and (general) quadrilaterals.
All commands require an origin coordinate (x,y) and usually some additional information, e.g. the radius for a circle, the width and height for a rectangle etc.
The minimum structure of a drawing needs three lines of code.
Example:
background(0,0,0)
drawCircle(120,120,50)
update()
The first line fills the background with black.
The second line draw a circle with a radius of 50 pixels at the positon x = 120 and y = 120.
The third line updates the display. Only with the update() command will the drawing commands become visible!
Besides the background color, you can also specify the outline and fill color. More about this under “How can I change the colors?”
In addition, the drawing area can be manipulated in various ways: Shifting the zero point, rotating the image around the (new) zero point, scaling (enlarge/reduce).
More about this under “Coordinate system” and “Coordinate transformation”.
Color spaces / systems
Colors are mixed on computer screens from the three primary colors red, green, and blue, which have varying degrees of luminosity. The individual values are given in a value scale from 0 to 255. This means that theoretically 255 x 255 x 255 = approx. 16 million colors are possible. Physically, however, the Oxocard can only display 65’536 effective colors. Here black is the combination r=0,g=0,b=0, and white r=255,g=255,b=255.
There are different classification systems for colors. For example, in colloquial language, different colors have certain names, such as turquoise blue, light pink, tomato red, kiwi green, etc. In the computer world, we use color spaces or systems. We use two common systems on the Oxocards: - the RGB system and - the HSV system
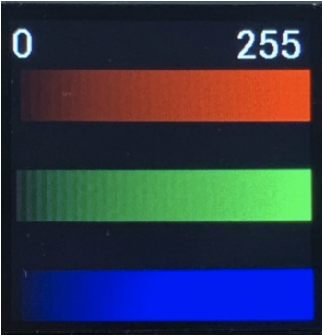
In the RGB system, the three color parts for red, green and blue are specified as described above, each with a number between 0 and 255. This system is also strongly represented in graphics programs or on websites. There are various tools on the Internet, where you can determine the color code of a desired color.
The following picture shows the possible color values for red, green and blue:
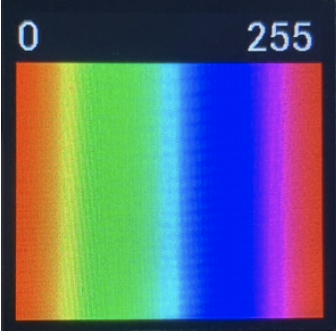
In HSV system we have three other values, Hue (H), Saturation (S) and Value (Brightness).
Hue is the color value. In the original Hue system, this value is arranged on a circle and the input corresponds to a value between 0 and 360 degrees. On the Oxocard have also limited the value ready to 0 to 255 for efficiency. The corresponding color values can be found here:
Saturation is a value between 0 and 255 and indicates the saturation of the color. 255 means that the color is very saturated. The lower the value, the grayer the color. “0” therefore corresponds to a gray value. The third value “Value” determines the brightness between 0 (very dark) and 255 (very bright).
Also with this system you can generate in principle all available colors, as in the RGB system.
With the HSV system can be produced very easily beautiful color transfer, because you only have to change the brightness or the strength of a fixed Hue value.
Example:
noStroke()
for i in 24:
    fillHSV(80,255,i*10)
    drawRectangle(0,i*10,240,10)
update()
push
push() and pop()
The function “push()” saves all current style configurations and coordinate transformations. With “pop()” you can then return to the original state (before push()).
Example:
fill(255,0,0) # set the fill color to red
translate(120,120) # new zero point is at 120,120
push() # we save the state
fill(0,255,0) # set fill color to blue
drawRectangle(-50,-50,100,100) # blue rectangle
pop() # we reset the state (before push())
drawCircle(0,0,30) # red circle
update() # output
Coordinate transformation
Basically, the zero point in the coordinate system is at the top left. But this can be changed. This is called coordinate transformation. In addition to changing the zero point, the drawing area can also be rotated and scaled (enlarged/reduced).
Example:
translate(120,120)
rotate(PI/6) # 30 degrees
stroke(255,0,0)
strokeWeight(2)
drawLine(0,0,120,0)
update()
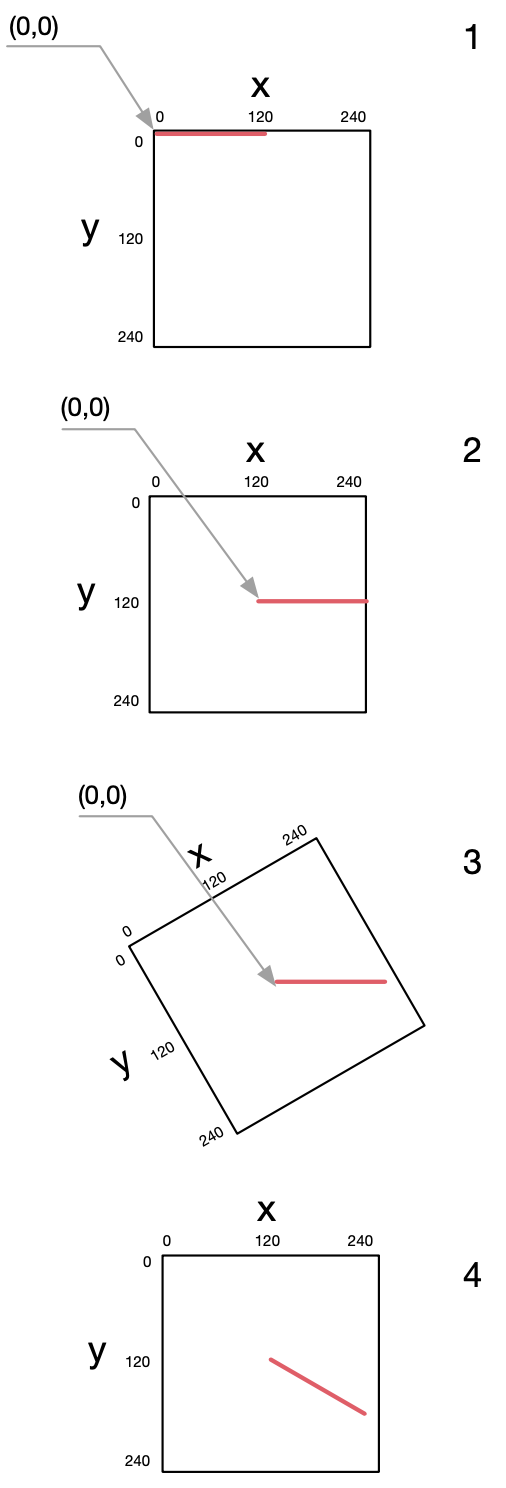
Line 1 transforms the zero point to the center of the image (figure, 2nd sketch).
Line 2 now rotates the drawing area clockwise by 30 degrees at the new zero point (PI2 is the total circumference, PI2/12 = PI/6 equals 30 degrees).
The 4th sketch of the figure shows the final result: the red line is drawn from the center of the image (translate(…)) and is rotated by thirty degrees (rotate(…)).
How can I change the colors?
As with normal drawing on paper, in NanoPy you must specify which color you want to work with before drawing. Colors can be set for three drawing functions:
background(r,g,b) or backgroundHSV(h,s,v) set the background color of the screen. When this command is called, the entire background is filled with the specified color.
fill(r,g,b) or fillHSV(h,s,v) determines the fill color. If you draw a rectangle, circle, etc, the object will be filled in the color you specify here. If you do NOT want to fill the object, call the function “noFill()”.
stroke(r,g,b) or strokeHSV(h,s,v) determines the stroke color. For all drawing functions you can decide if you want to add an outline or if you want to fill it. You can also omit the contour by calling the function “noStroke()”.
More information about colors under “Color spaces and systems”.
Coordinate system
The Oxocard screen uses a Cartesian coordinate system with a horizontal x-axis and a vertical y-axis. Unlike mathematics, the origin of screens is usually the top left and not the bottom left.