2D graphic functions
textAlignment
textAlignment(alignment:byte)
textAlignment(alignment:byte)
This function can be used to adjust the text alignment of the drawText function. There are three options: TEXT_ALIGN_LEFT: left-aligned TEXT_ALIGN_CENTER:centered TEXT_ALIGN_RIGHT:right-aligned
Here is an example:
def onDraw():
    clear()
    drawLine(120,0,120,240)
    textAlignment(TEXT_ALIGN_LEFT)
    drawText(120,80,"Hello")
    textAlignment(TEXT_ALIGN_CENTER)
    drawText(120,120,"Hello")
    textAlignment(TEXT_ALIGN_RIGHT)
    drawText(120,160,"Hello")
    update()
drawRectangleRounded
drawRectangleRounded(x0:int,y0:int,w:int,h:int,radius:int)
Draw a rounded rectangle starting at x0/y0 with width w and height h and the specified radius.
drawRectangleRounded(5,5,230,230,10)
update()
drawSprite
drawSprite(x:int, y:int, w:int, h:int, buf:byte[])
This function draws an 8bit encoded image.
x/y determine the coodinates. Sprites are always drawn centered, i.e. the coordinate corresponds to the center.
w/h corresponds to the width w and the height h of the image.
buf: here are the image data. The number of bytes must correspond to the quantity w*h. Each byte corresponds to one pixel, and the bytes must be specified line by line. If a width of 8 pixels and a height of e.g. 12 pixels is declared, then we find in the buf variable first the 8 pixels of the first row, then the 8 pixels of the second row and so on.
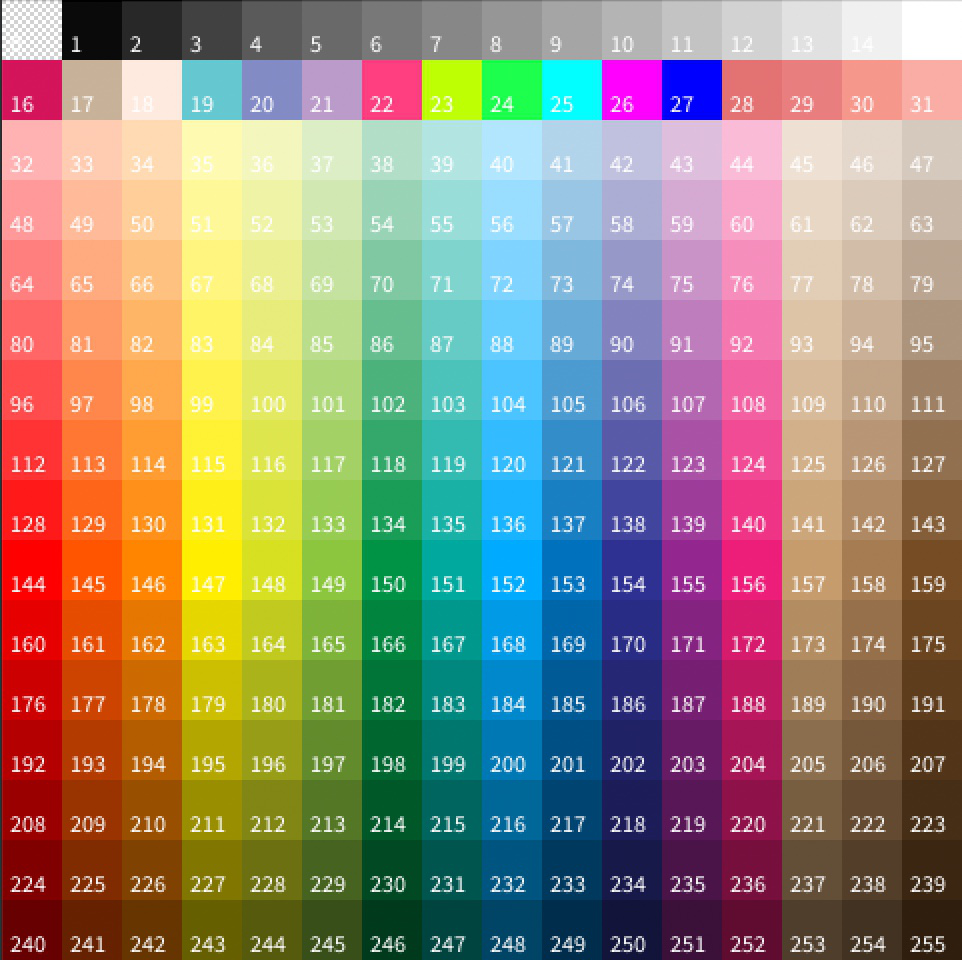
To use less space, only 256 colors are available, i.e. the color code is a number between 0 and 255, where 0 means transparent.
The following example draws a flying cow with an image size of 24x24 pixels. Since this is only one tenth of the width/height of the screen, the image is enlarged four times with scale(4).
# image
flyingCow:byte[24*24] = [
0,0,0,0,0,0,0,0,0,0,0,0,0,0,0,0,0,0,0,0,0,0,0,0,
0,0,0,0,0,0,0,0,0,0,191,0,0,0,0,0,0,0,0,0,0,191,0,0,
0,0,0,0,0,0,0,0,1,1,191,1,1,1,1,1,0,0,0,0,191,191,0,0,
0,0,0,0,0,0,1,1,14,14,191,191,191,14,14,14,1,1,1,191,174,191,0,0,
0,0,0,0,0,1,14,14,14,14,191,174,174,191,14,1,1,1,14,1,174,191,0,0,
0,0,0,0,1,14,14,14,14,14,14,191,191,14,14,14,14,14,14,14,1,0,0,0,
0,0,0,1,62,0,14,1,1,14,14,1,14,14,14,14,14,1,14,1,14,1,0,0,
0,0,1,62,62,0,1,1,1,1,1,62,62,14,14,14,14,1,14,1,14,1,1,0,
0,0,0,62,62,0,14,1,1,14,14,14,62,0,14,14,14,14,14,14,14,1,14,0,
0,1,1,62,62,0,14,14,1,1,1,1,62,62,0,14,14,176,176,176,176,176,1,1,
0,1,1,1,62,0,14,14,14,14,14,1,62,62,0,14,176,113,176,113,176,113,176,0,
0,1,1,1,1,0,14,14,14,14,14,14,1,62,62,14,176,113,176,113,176,113,176,0,
0,1,1,1,62,62,14,14,14,14,14,14,1,62,62,62,62,176,176,176,176,176,1,0,
0,0,1,62,62,62,62,14,14,14,1,14,14,1,62,62,62,62,62,62,1,1,0,0,
0,0,1,62,62,62,62,14,14,1,14,14,14,14,1,1,1,1,1,1,14,1,0,0,
0,1,14,1,62,62,62,14,1,14,14,14,14,14,14,14,14,14,14,14,1,14,1,0,
1,1,62,62,1,62,62,1,1,14,14,1,14,14,14,14,14,14,14,1,62,14,1,1,
1,1,1,1,0,1,62,1,1,1,1,62,62,62,62,62,62,62,1,0,1,1,1,1,
0,1,1,0,0,176,1,1,1,1,62,62,62,62,62,62,1,1,0,0,0,1,1,0,
0,0,0,0,176,176,113,113,1,1,1,1,1,1,1,1,0,0,0,0,0,0,0,0,
0,0,0,0,0,176,113,113,113,113,113,176,0,0,0,0,0,0,0,0,0,0,0,0,
0,0,0,0,176,176,176,176,176,176,176,0,0,0,0,0,0,0,0,0,0,0,0,0,
0,0,0,0,0,176,0,0,176,0,0,0,0,0,0,0,0,0,0,0,0,0,0,0,
0,0,0,0,0,0,0,0,0,0,0,0,0,0,0,0,0,0,0,0,0,0,0,0
]

background(120,120,120)
translate(120,120)
scale(4)
drawSprite(0,0,24,24,flyingCow)
update()
If you write the statement “# image” before the declaration, the image can be changed in the constant editor using a visual image editor.
Important notes: The image size can be arbitrary, but should not exceed 24x24 pixels. The editor can currently only change images that are exactly 24x24 pixels. An image of 24x24 pixels already needs 576 bytes (!).
More tips:
Images can be enlarged, reduced, rotated and moved arbitrarily by using the commands translate/rotate/scale.
In order for the pixel images to be visible, it is usually worth enlarging them 2 to 4 times.
drawCharCentered
drawCharCentered(x:int,y:int,ch:byte)
This function is identical to drawChar(..), but the character is drawn centered to the x/y coordinate (instead of top left). So in combination with the rotate() and scale() functions it is now possible to rotate or enlarge/reduce a character centered.
drawCharCentered(120,120,'$')
Important:
Single characters must be specified with single apostrophe, unlike strings.
drawTextCentered
drawTextCentered(x:int,y:int,text:byte[])
This function is identical to drawText(..), but the text is drawn centered to the x/y coordinate (instead of top left). So in combination with the rotate() and scale() functions it is now possible to rotate or enlarge/reduce a text centered.
drawTextCentered(120,120, "Hello World!")
drawImageMonoCentered
drawImageMonoCentered(x:int,y:int,w:int,h:int,buf:byte[])
This function is identical to drawImageMono(..), but the image is drawn centered to the x/y coordinate (instead of top left). So in combination with the rotate() and scale() functions it is now possible to rotate or enlarge/reduce an image centered.
scale
scale(v:float)
Scales all subsequent drawing commands by the specified value. For example, the size doubles with the value 2 or halves with 0.5.
Note: scale() is multiplicative. This means that, for example, scale(2) and scale(1.5) together achieve the same effect as a single scale(3).
Example:
translate(120,120)
drawCircle(0,0,10)
update()
delay(1000)

scale(2)
drawCircle(0,0,10)
update()
delay(1000)

scale(1.5)
drawCircle(0,0,10)
update()
noClipping
noClipping()
Use noClipping() to override a previously used clipRectangle().
clipRectangle
clipRectangle(x:int,y:int,w:int,h:int)
Use clipRectangle() to draw only in a specific area (rectangle) on the screen.
This can be used to output only certain parts of a drawing, for example:
push()
stroke(255,0,0)
drawRectangle(0,120,240,120)
clipRectangle(0,120,240,120)
fill(255,0,0)
drawCircle(120, 120, 100)
update()
delay(1000)
pop()

push()
stroke(0,255,0)
drawRectangle(0,0,240,120)
clipRectangle(0,0,240,120)
fill(0,255,0)
drawCircle(120, 120, 100)
update()
delay(1000)
pop()

push()
stroke(0,0,255)
drawRectangle(0,0,120,240)
clipRectangle(0,0,120,240)
fill(0,0,255)
drawCircle(120, 120, 100)
update()
delay(1000)
pop()
addBezierVertex
addBezierVertex(x:int,y:int)
Adds a Bezier curve to a polygon definition. Important: The x/y coordinates determine the Bezier breakpoint. The curve is then drawn between the enclosed addVertex statements, as demonstrated in the following example:
const BEZIER_X = 50 # 10..100
const BEZIER_Y = 60 # 10..100

clear()
fill(100,100,255)
noStroke()
translate(120,120)
for i in 4:
    rotate(PI/2)
    beginShape();
    addVertex(0, 0)
    addBezierVertex(-BEZIER_X, BEZIER_Y)
    addVertex(0, 70)
    addBezierVertex(BEZIER_X, BEZIER_Y)
    addVertex(0, 0)
    endShape(true)

noFill()
stroke(255,0,0)
drawCircle(BEZIER_X,BEZIER_Y,5)
update()
This example draws the bezier point as a red circle. This can be changed in the constant editor
clear
clear()
Erases all the pixels on the screen.
For the function to be visible, an “update()” must be executed afterwards:
clear()
update()
drawImageMono
drawImageMono(x:int,y:int,w:int,h:int,buf:byte[])
Draws a monochrome image at position x/y with width w and height h. The data of the image are stored in the variable buf.
Example:
b = [ 0b11100000, 0b00000111,
      0b10100000, 0b00000101,
      0b11100000, 0b00000111,
      0b000000, 0b000000,
      0b000000, 0b000000,
      0b000000, 0b000000,
      0b00100000, 0b00000100,
      0b00111111, 0b11111100]
drawImageMono(120,120,16,8,b)
update()
Binary numbers are used in the example. “0b” here is respectively the initial signature, which tells NanoPy that bits are coming now.
Important:
The image data can have any width divisible by 8. In the above example, 16 bits have been specified in the width.
In height, the number can be any number. However, the number of lines must match the parameter h.
strokeHSV
strokeHSV(h:byte,s:byte,v:byte)
Sets the stroke or outline color in HSV color mode.
h = hue (color value between 0 and 255) s = saturation(saturation, between 0 and 255) v = value (brightness, between 0 and 255)
update
update()
This function transfers the image memory to the screen. Without “update()” the screen is not updated, therefore this function is omnipresent and is called at least once in every program.
The transfer of the image memory is relatively slow. It is therefore worthwhile to think carefully about when it is best to execute an “update()”.
Example 1: update() is only called after 50 rectangles. The program works very smoothly.
background(0,0,0)
def onDraw():
    for i in 50:
        fillHSV(random(0,255),255,255)
        x = random(0,240/16)
        y = random(0,240/16)
        drawRectangle(x*16,y*16,16,16)
    update()
Example 2: here we called “update()” after each rectangle. The program works much slower.
background(0,0,0)
def onDraw():
    for i in 50:
        fillHSV(random(0,255),255,255)
        x = random(0,240/16)
        y = random(0,240/16)
        drawRectangle(x*16,y*16,16,16)
        update()
translate
translate(x:int,y:int)
Moves the zero point to the position x/y.
The function is additive. Each additional call moves the zero point relative to the previous position. If you don’t want this, you can use push()/pop(), which will restore the original state.
Example:
push()
translate(120,120)
drawCircle(0,0,40)
drawCircle(0,0,80)
pop()
push()
translate(200,200)
drawCircle(0,0,20)
pop()
update()
drawPixel
drawPixel(x:int,y:int)
Draws a pixel at the position x/y.
drawCircle
drawCircle(x0:int,y0:int,r:byte)
Draws a circle at the position x0/y0 with a radius r.
drawCircle(120,120,50)
update()
drawEllipse
drawEllipse(x0:int,y0:int,r0:byte,r1:byte)
Draws a circle at position x0/y0 with radii r0 and r1.
drawQRCode
drawQRCode(x:int,y:int,pixelSize:byte,invert:bool,str:byte[])
Draws a QR code at the position x/y with the size pixelSize. invert specifies whether the QR code should be inverted. i byte parameter the text information of the QR code must be specified.
background(0,0,0)
drawQRCode(0,0,8,false, "https://www.oxocard.ch")
update()
push
push()
The function “push()” saves all current style configurations and coordinate transformations. With “pop()” you can then return to the original state (before push()).
Example:
fill(255,0,0) # set the fill color to red
translate(120,120) # new zero point is at 120,120
push() # we save the state
fill(0,255,0) # set fill color to blue
drawRectangle(-50,-50,100,100) # blue rectangle
pop() # we reset the state (before push())
drawCircle(0,0,30) # red circle
update() # output
drawArc
drawArc(x0:int,y0:int,r:byte,start:float,angle:float)
Draw an arc at the position x0/y0 with a radius r. The arc is specified in radians and started at start and is “angle” long.
drawArc(120,120,100,0,PI/2)
update()
textFont
textFont(fontid:byte)
Specifies the font. This can be specified either as a number or with the following constants:
FONT_ROBOTO_16
FONT_ROBOTO_24
FONT_ROBOTO_32
FONT_ROBOTO_48
FONT_ROBOTO_80
FONT_ROBOTO_BOLD_16
FONT_ROBOTO_BOLD_24
FONT_ROBOTO_BOLD_32
FONT_ROBOTO_BOLD_48
The fonts are a combination of font type (Roboto regular and bold) and pixel size (16 to 80).
textFont(FONT_ROBOTO_32)
drawText(20,20, "Hello")
update()
pop
pop()
Resets the state previously saved with push().
Example: see push()
addVertex
addVertex(x:int,y:int)
This function adds a point at location x/y in a polygon definition.
Example: see beingShape()
endShape
endShape(closed:bool)
This function closes a polygon definition. If closed is set to true, the last point is also connected to the first point to form a closed line.
When endShape() is called, the polygon is drawn into the screen buffer.
Example: see beginShape()
textLeading
textLeading(leading:int)
Distance between the letters of a text.
rotate
rotate(rad:float)
Rotates the drawing around the current zero point.
rad = Rotation in Radian (0 to 2*PI)
rotate is often used in connection with push/pop and translate. You can use this function to rotate any object around any axis.
Example:
translate(120,120)
for i in 12:
    drawRectangle(50,-5,20,10)
    rotate(PI/6)
update()
beginShape
beginShape()
Starts a polygon definition. This consists of a beginShape(), several calls to addVertex/Bezier and a termination with endShape().
Example:
translate(120,120)
fill(255,0,0)
beginShape()
a:float
for i in 12:
    a = a + PI/6
    addVertex(cos(a)*100,sin(a)*100)
endShape(true)
update()
This example sets the origin to the center of the screen. Then, begin/endShape() is used to open a polygon bracket. “addVertex” is used to add twelve points on a circle. So this polygon represents a circle of 12 points.
backgroundHSV
backgroundHSV(h:byte,s:byte,v:byte)
Sets the background color in HSV color mode.
h = hue (color value between 0 and 255) s = saturation(saturation, between 0 and 255) v = value (brightness, between 0 and 255)
drawChar
drawChar(x:int,y:int,ch:byte)
Draw a sign.
drawChar(10,10,'?')
Important:
Single characters, unlike strings, must be specified with single apostrophe.
drawText
drawText(x:int,y:int,text:byte[])
Draws a text.
drawText(10,10, "Hello World!")
textWidth
textWidth(text:byte[])->int
Calculates the width in pixels, based on the current font, that the passed text will take up when output. This allows a text block to be centered or right-aligned.
<br
textFont(FONT_ROBOTO_48)
w = textWidth("Hello")
drawText(0,40, "Hello")
drawText(240-w, 100, "Hello")
drawText(120-w/2,160,"Hallo")
update()
fill
fill(r:byte,g:byte,b:byte)
Fills the object drawn below with the specified color.
r = red (0-255) g = green (0 - 255) b = blue (0 - 255)
fill(255,0,0)
drawRectangle(5,5,50,50)
update()
noStroke
noStroke()
After calling this function, no more contours are drawn.
stroke(255,255,255)
fill(255,0,0)
drawRectangle(5,5,50,50)
noStroke()
drawRectangle(100,5,50,50)
update()
drawTriangle
drawTriangle(x0:int,y0:int,x1:int,y1:int, x2:int, y2:int)
Draw a triangle with coordinates x0/y0, x1/y1, and x2/y2.
drawTriangle(5,5,100,5,50,100)
update()
drawRectangle
drawRectangle(x0:int,y0:int,w:int,h:int)
Draws a rectangle starting at x0/y0 with width w and height h.
drawRectangle(5,5,230,230)
update()
strokeWeight
strokeWeight(w:byte)
Sets the tally marks from 1 to 10.
stroke(255,255,255)
strokeWeight(1)
drawLine(0,40,240,40)
strokeWeight(5)
drawLine(0,80,240,80)
update()
drawLine
drawLine(x0:int,y0:int,x1:int,y1:int)
Draws a line from x0/y0 to x1/y1.
drawLine(0,0,240,240)
update()
background
background(r:byte,g:byte,b:byte)
Sets the background color.
r = red (0-255) g = green (0 - 255) b = blue (0 - 255)
background(255,0,0)
update()
stroke
stroke(r:byte,g:byte,b:byte)
Sets the stroke or account color.
r = red (0-255) g = green (0 - 255) b = blue (0 - 255)
stroke(255,0,0)
drawLine(0,0,240,240)
update()
noFill
noFill()
After calling this function, objects are no longer filled.
stroke(255,255,255)
fill(255,0,0)
drawRectangle(5,5,50,50)
noFill()
drawRectangle(100,5,50,50)
update()
drawQuadrangle
drawQuadrangle(x0:int,y0:int,x1:int,y1:int,x2:int,y2:int,x3:int,y3:int)
Draws a quadrilateral with coordinates x0/y0, x1/y1,x2/y2 and x3/y3.
fillHSV
fillHSV(h:byte,s:byte,v:byte)
Sets the fill color in HSV color mode.
h = hue (color value between 0 and 255) s = saturation(saturation, between 0 and 255) v = value (brightness, between 0 and 255)